Development of evaluation methods for flame retardancy of materials to improve space fire safety (FLARE1 Theme)
1. Background and Objective
In space craft, ignition of electric wire is one of the main reason to cause fire accidents. To prevent fire accident, our research group has been studying on ignition of electrical wire insulation with excess electric current under 1G and µG. According to past research, we’ve reported ignition is caused more easily under µG than 1G [1]. Under µG, natural convection is suppressed and this has two effects on wire ignition phenomena .First, fuel gas is supposed to be easier to stay around sample wire under µG than 1G. Second, convective heat loss from the sample is expected to be suppressed under µG. From these reasons, we consider ignition occurs more under µG than 1G.
Moreover in previous research, to simulate operating circuit breaker, research about ignition of electric wire with short-term current supply (less than 1 s) has studied. This research has been conducted with experimental [2] and numerical [3] approach. However, to get safe current value enough to use for long periods in ISS, research about long-term current supply hasn’t studied enough yet.
Therefore, in this study, we approach the research about ignition of insulated electric wire with long-term current supply by experiments and numerical calculation. Furthermore we set final objective to reveal mechanism to decide ignition limit with long-term current supply.
2. Experiment
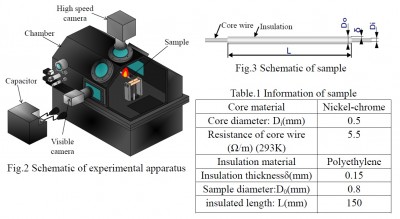
Fig.3 shows the experimental apparatus. The main constitutions of equipment are combustion chamber, capacitor, sample inside chamber, high speed camera and visible camera. We provide optional excess current value to sample from capacitor and record the ignition behavior by two different video cameras. By changing current value, current applied time and ignition limit are obtained. Sample is made of NiCr wire insulated PE like Fig.3. For getting µG, we use parabolic flights by DAS (Diamond Air Service.co, Komaki, Aichi). The µG time of parabolic flight is about 20 s.
3. Result and Discussion
In this study, we estimate the ignition phenomena by using the limit of current value of ignition (: minimum current value for ignition at each oxygen concentration) and applied time (: the time from start of the electric current to ignition).
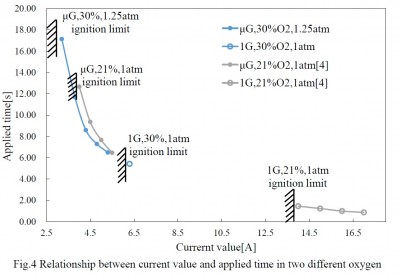
Fig.4 shows experimental results under 1G and µG. Overall trend of Fig.4 is the applied time increases as the current value decreases. Focusing on 21% oxygen concentration data in constant pressure under 1G and µG, ignition limit significantly decreases in µG compared with 1G. Accordingly, applied time also drastically increases in µG compared with 1G. We think this is caused by suppression of natural convection under µG, but detail mechanism to decide ignition limit haven’t clarified yet. As future efforts, we try to reveal detail mechanism to decide ignition limit with further qualitative/quantitative evaluation. In order to do that, while approaching numerical method, we try to conduct experiments and collect more data addition to experiment data so far.
Reference
[1]Fujii, T., 44th Japanese Combustion Symposium, (2006),pp.230-231
[2]Fujita.O.,et al, Proceeding of the Combustion Institute 33(2011)2617-2623
[3]Takano, Y., et al, Proceeding of Combustion Institute 34(2013)2665-2673
[4]Shigeta,N., et al., 43rd International Conference on Environmental Systems, July 14-18, 2013./AIAA2013-3387.